(Source: Freeheel Solutions LLC)
Mr. Mahalanobis and his distance
Many data scientists know Mahalanobis distance as a reliable tool for cleaning data. The method has been around since 1936, when introduced by P.C. Mahalanobis, a founder of the Indian Statistical Institute. It is commonly used to determine how far a data point is from the center of a multi-dimensional distribution, analogous to using standard deviation to measure distance from the mean, when working with only one feature. Just as standard deviation can help identify outliers to be removed from the extreme ends of normally distributed data. Mahalanobis distance can be used to find points that are at the extreme limits of multi-variate data. And when working on classification problems, I learned you can do a lot more than just clean data with this seemingly simple distance measure.
My client and I had been analyzing K-means results, thinking about how to best apply them to the challenge of categorizing businesses within and across the clusters. These businesses might be the same kind of business, e.g. bike shops, or might belong to the same chain business, e.g. Home Depot. The K-means model grouped business using demographic and economic information related to the physical address of each location. Still, we knew there was more to understand about how, and ideally why businesses chose to open shop in certain places and not others.
This is where applying the Mahalanobis distance in different way helped push our thinking forward. Not as well known, perhaps, is how Mahalanobis distance can be used to build an effective one-class classifier. Selva Prabhakaran provides an excellent summary in his online article. This technique is especially useful when working data like ours, where there is no “ground truth” available to train a model on what is “in” or “out” of a class. What’s more, the technique allows you to apply the Chi-Squared distribution to determine statistical significance of the results. Even without the rigor of a critical value cutoff, we found Mahalanobis distance useful to see how consistent a chain business was in selecting their locations.
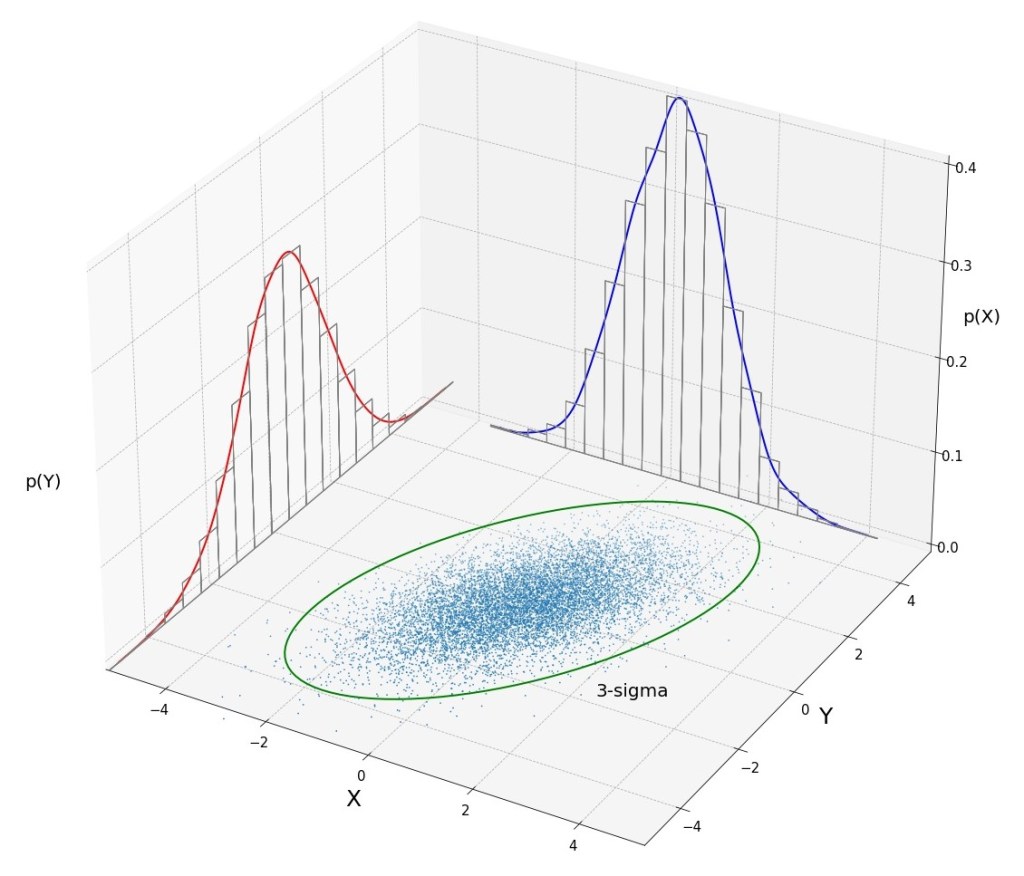
We ultimately decided against using a Mahalanobis based classifier to group business locations further, for two reasons, a) our samples sizes within the clusters were often quite small, and b) the Mahalanobis distance tells you just that, the distance a data point is from the mean of a distribution, and not “direction.” To illustrate this, think about 2-D space, using familiar X-Y coordinates. The points (X = 1, Y = 0), and (X = -1, Y = 0) are both the same distance from the origin, but in opposite directions. Digging into and determining the directional components of multivariate space is a task best left to a classifier and we didn’t believe our sample sizes would deliver useful results. Instead, we chose to work on improving the data available to the K-means model and tuning its parameters.
Although I did not leverage Mahalanobis distance this time, I remain impressed by its simplicity and versatility. I can’t wait to find new and creative ways to apply Mr. Mahalanobis’ s innovation in my practice.
